Clear-aligner case volume
Approx. 532,400Up 48.1%; global markets outside Chinese mainland contributed approximately 256,200 cases, up 82.1%.
Year ended 31 December 2025 · cases HKEX · PDF page 10HKEX 06699 · Unpaid pilot profile
Angelalign Technology Inc.
Angelalign provides clear-aligner treatment solutions across Chinese mainland and global markets. In 2025 it reported revenue of USD370.281 million, net profit of USD26.327 million and a gross margin of 62.9%; total case volume was approximately 532,400, including approximately 256,200 cases outside Chinese mainland.
This is an unpaid PureIR pilot independently prepared from formal disclosure. The company did not commission or pay for the profile and did not participate in any rating or investment judgement.
Press and guide the scattered points back to the arch
An editorial metaphor for the digital clear-aligner workflow; it does not represent an individual treatment outcome.
Disclosure highlights
Up 48.1%; global markets outside Chinese mainland contributed approximately 256,200 cases, up 82.1%.
Year ended 31 December 2025 · cases HKEX · PDF page 10Up 37.8%; revenue outside Chinese mainland rose 102.5% to USD163.0 million.
Year ended 31 December 2025 · USD million HKEX · PDF page 10Up 163.0%; gross margin for the same period was 62.9%.
Year ended 31 December 2025 · USD million HKEX · PDF page 10Disclosure reading
PureIR disclosure synthesis
The company mainly provides treatment-solution services in Chinese mainland and sells clear aligners outside Chinese mainland. Case volume grew in both market groups in 2025, with faster growth outside Chinese mainland.
HKEX · PDF page 10PureIR disclosure synthesis
The disclosed global expansion model combines product R&D, clinical support, digital technology, treatment planning, manufacturing and delivery, and local commercial service.
HKEX · PDF page 15PureIR disclosure synthesis
Revenue, gross profit and net profit all increased in 2025, while the adjusted segment loss outside Chinese mainland narrowed; the company also noted that the timing of certain expenses affected annual profit.
HKEX · PDF page 10Business model
Clear-aligner treatment solutions
USD 198.251 million FY2025 PDF page 16Sales of intraoral scanners
RMB 44.391 million FY2022 PDF page 22Other services
USD 2.138 million FY2025 PDF page 16Sales of clear aligners
USD 154.384 million FY2025 PDF page 16Sales of other products
USD 15.508 million FY2025 PDF page 16Annual series
Annual series
| Metric | Period | Value | Source |
|---|---|---|---|
| Clear-aligner treatment solutions | FY2021 | RMB 1,183.801 million | PDF page 17 |
| Sales of intraoral scanners | FY2021 | RMB 68.099 million | PDF page 17 |
| Other services | FY2021 | RMB 19.777 million | PDF page 17 |
| Clear-aligner treatment solutions | FY2022 | RMB 1,209.582 million | PDF page 22 |
| Sales of intraoral scanners | FY2022 | RMB 44.391 million | PDF page 22 |
| Other services | FY2022 | RMB 15.733 million | PDF page 22 |
| Clear-aligner treatment solutions | FY2023 | USD 182.075 millionUses the USD comparative restated in the FY2024 annual report; the company adopted USD as its presentation currency from FY2024. | PDF page 16 |
| Sales of clear aligners | FY2023 | USD 14.867 millionUses the USD comparative restated in the FY2024 annual report. | PDF page 16 |
| Sales of other products | FY2023 | USD 10.124 millionUses the USD comparative restated in the FY2024 annual report. | PDF page 16 |
| Other services | FY2023 | USD 2.55 millionUses the USD comparative restated in the FY2024 annual report. | PDF page 16 |
| Clear-aligner treatment solutions | FY2024 | USD 179.625 million | PDF page 16 |
| Sales of clear aligners | FY2024 | USD 74.008 million | PDF page 16 |
| Sales of other products | FY2024 | USD 12.729 million | PDF page 16 |
| Other services | FY2024 | USD 2.425 million | PDF page 16 |
| Clear-aligner treatment solutions | FY2025 | USD 198.251 million | PDF page 16 |
| Sales of clear aligners | FY2025 | USD 154.384 million | PDF page 16 |
| Sales of other products | FY2025 | USD 15.508 million | PDF page 16 |
| Other services | FY2025 | USD 2.138 million | PDF page 16 |
Structured disclosure
Revenue
USD 370.281 million FY2025 PDF page 190Gross profit
USD 232.889 million FY2025 PDF page 190Net profit
USD 26.327 million FY2025 PDF page 190Gross margin
62.9% FY2025 PDF page 10Annual series
Annual series
Annual series
Annual series
| Metric | Period | Value | Source |
|---|---|---|---|
| Revenue | FY2021 | RMB 1,271.677 million | PDF page 190 |
| Gross profit | FY2021 | RMB 826.646 million | PDF page 190 |
| Net profit | FY2021 | RMB 285.572 million | PDF page 190 |
| Revenue | FY2022 | RMB 1,269.706 million | PDF page 190 |
| Gross profit | FY2022 | RMB 785.69 million | PDF page 190 |
| Net profit | FY2022 | RMB 213.157 million | PDF page 190 |
| Revenue | FY2023 | USD 209.616 millionThe five-year summary changes presentation currency from RMB to USD beginning in FY2023. | PDF page 190 |
| Gross profit | FY2023 | USD 130.708 million | PDF page 190 |
| Net profit | FY2023 | USD 6.833 million | PDF page 190 |
| Revenue | FY2024 | USD 268.787 millionRestated in the FY2025 annual report. | PDF page 190 |
| Gross profit | FY2024 | USD 168.228 millionRestated in the FY2025 annual report. | PDF page 190 |
| Net profit | FY2024 | USD 10.016 millionRestated in the FY2025 annual report. | PDF page 190 |
| Revenue | FY2025 | USD 370.281 million | PDF page 190 |
| Gross profit | FY2025 | USD 232.889 million | PDF page 190 |
| Net profit | FY2025 | USD 26.327 million | PDF page 190 |
| Gross margin | FY2025 | 62.9% | PDF page 10 |
Structured disclosure
Total clear-aligner case volume
532,400 cases FY2025 PDF page 10Chinese mainland case volume
276,200 cases FY2025 PDF page 10Case volume outside Chinese mainland
256,200 cases FY2025 PDF page 10Annual series
| Metric | Period | Value | Source |
|---|---|---|---|
| Total clear-aligner case volume | FY2021 | 183,200 cases | PDF page 12 |
| Total clear-aligner case volume | FY2022 | 183,900 cases | PDF page 8 |
| Total clear-aligner case volume | FY2023 | 245,000 cases | PDF page 9 |
| Total clear-aligner case volume | FY2024 | 359,400 cases | PDF page 10 |
| Total clear-aligner case volume | FY2025 | 532,400 cases | PDF page 10 |
| Chinese mainland case volume | FY2025 | 276,200 cases | PDF page 10 |
| Case volume outside Chinese mainland | FY2025 | 256,200 cases | PDF page 10 |
Structured disclosure
Net cash from operating activities
USD 78.567 million FY2025 PDF page 99Cash and term deposits
USD 444.9 million 2025-12-31 PDF page 19Annual series
Annual series
| Metric | Period | Value | Source |
|---|---|---|---|
| Net cash from operating activities | FY2021 | RMB 441.713 million | PDF page 22 |
| Net cash from operating activities | FY2022 | RMB 146.87 million | PDF page 27 |
| Net cash from operating activities | FY2023 | USD 22.288 millionUses the USD comparative restated in the FY2024 annual report. | PDF page 95 |
| Net cash from operating activities | FY2024 | USD 16.917 million | PDF page 95 |
| Net cash from operating activities | FY2025 | USD 78.567 million | PDF page 99 |
| Cash and term deposits | 2025-12-31 | USD 444.9 million | PDF page 19 |
Leadership profile
Roles and biographies follow formal disclosure. Portraits are used only when published on the company’s official website.

01 / 06
Chairman and Executive Director
Joined the Group in 2012 and is responsible for strategy, corporate governance, risk management and business development; re-designated as an executive director with effect from 23 April 2026.
02 / 06
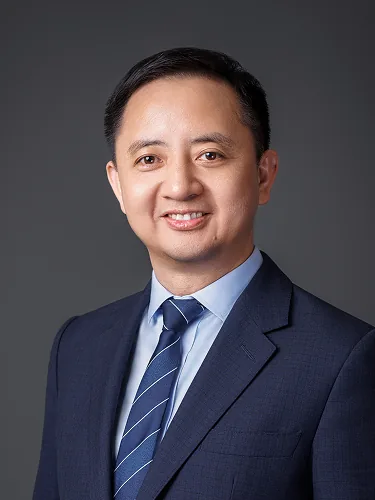
Executive Director, Chief Executive Officer and Chief Technology Officer
Responsible for overall strategic planning and daily operations, including digital-technology development; appointed chief executive officer in July 2023.

03 / 06
Executive Director and President of Global Business (ex-Chinese mainland)
Responsible for international strategy and business operations and expansion outside Chinese mainland; joined the Group in 2015.

04 / 06
Executive Director and Chief Financial Officer
Re-designated as an executive director and appointed chief financial officer in April 2023, with finance leadership experience in technology companies.
05 / 06
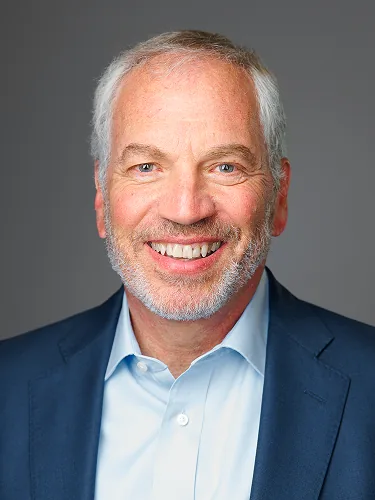
Senior Vice President and Global Chief Commercial Officer
Responsible for commercial operations outside China, with more than 25 years of global commercial experience in oral healthcare; joined the Group in August 2024.

06 / 06
Chief Strategy Officer
Joined the Group in 2011, served as an executive director from April 2021 to April 2026, and remains chief strategy officer.
Official market reference
PureIR does not display or redistribute market-price data.
View 06699 on HKEX ↗Formal disclosure
Operations across multiple jurisdictions expose the company to healthcare-policy, international-trade, data-security and privacy changes that may raise compliance costs and affect the business.
HKEX · PDF page 15Industry competition, the macro environment and product-mix shifts may affect case volume, average selling prices and margins; the company disclosed product-mix pressure on mainland treatment-solution pricing.
HKEX · PDF page 16The Group operates in RMB, USD, EUR and BRL and faces translation and transaction exposure; the annual report states that no hedging arrangements had been implemented.
HKEX · PDF page 19The company has continuing connected transactions with a distributor controlled by a controlling shareholder; the 2027–2029 framework and annual caps require independent-shareholder approval and remain subject to Listing Rules.
HKEX · PDF page 2Evidence